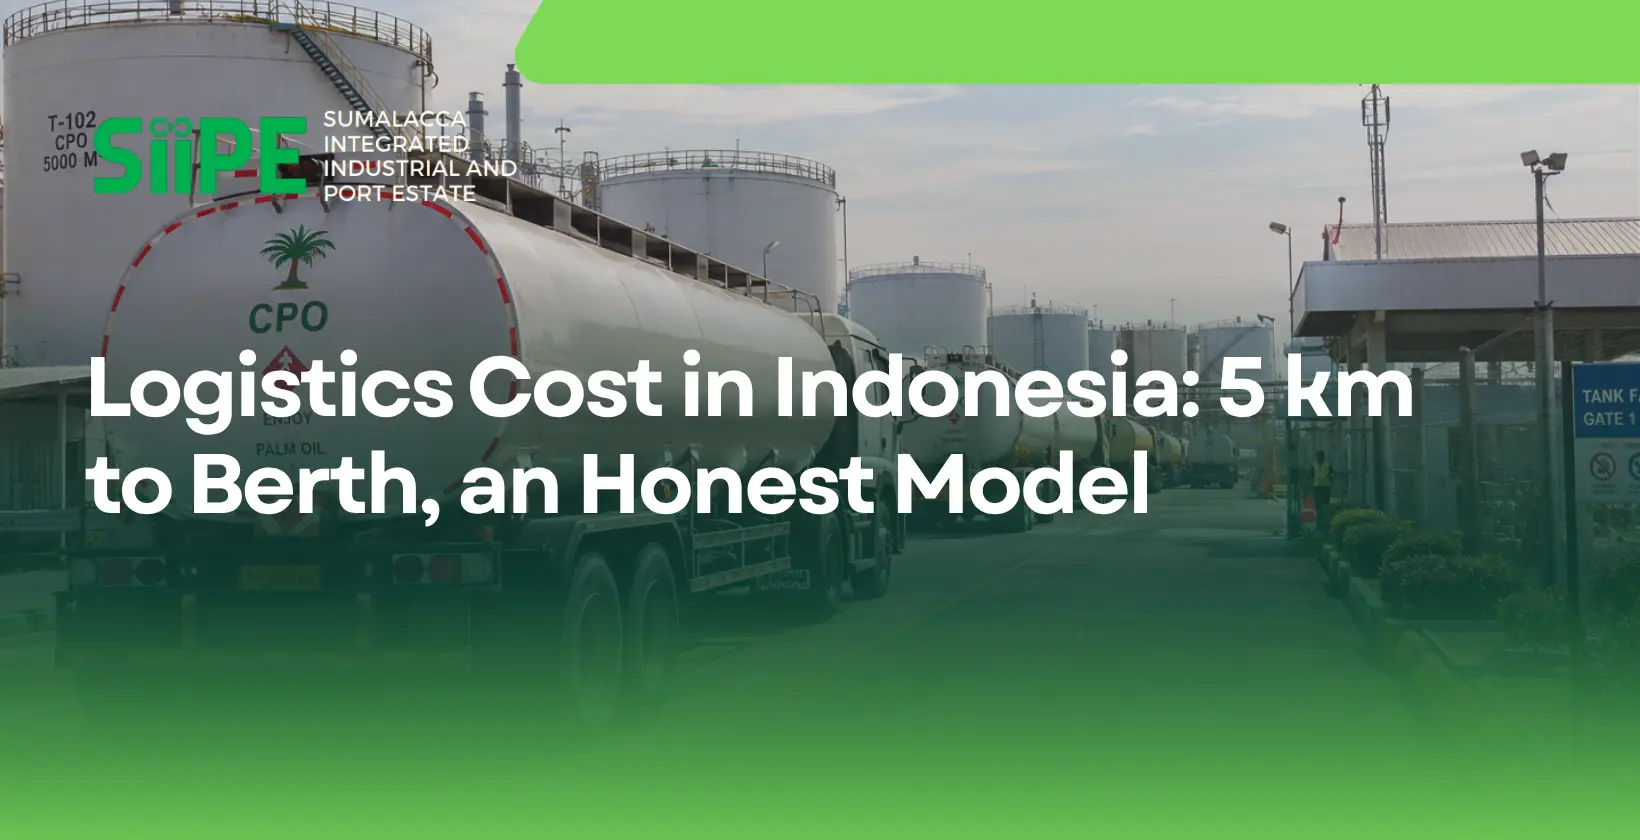
Logistics cost in Indonesia ran at 14.29% of GDP in 2022, and the government has now put a Presidential Regulation behind cutting it: Perpres 41 of 2026, with an intermediate target of 12.5% and 8% by 2045. Those are national numbers. A plant does not pay a national number. It pays a truck rate, a handover charge and a loss allowance on every tonne that moves between its gate and a ship, and the size of that bill is set by one variable the plant chose on the day it picked a site: the distance to the berth.
We develop an industrial estate in North Sumatra whose masterplan puts every plot under 5 km from a berth, so we have a view. This page argues it with a tonnage model rather than a brochure. Our earlier page modelled the same question for a container shipper; this one is for bulk, where the cargo moves in tankers and tippers and the arithmetic bites harder.
Last updated: 22 October 2026
Where Logistics Cost in Indonesia Actually Goes
The headline figure hides its own composition, and the composition is the point. A policy review by Tenggara Strategics, drawing on Ministry of National Development Planning data, breaks the 2022 domestic logistics cost of about 14.1% of GDP into five lines; the government’s 14.29% baseline for the same year uses a slightly different cut, and the shape is what matters.
| Component of domestic logistics cost, 2022 | Share of GDP | Share of the total |
|---|---|---|
| Road transport | 7.0% | about half |
| Sea transport | 3.6% | a quarter |
| Air transport | 0.8% | 6% |
| Warehousing and storage | 1.5% | 11% |
| Administration | 1.2% | 9% |
| Total | 14.1% |
Half of the national logistics bill is road. That matters for site selection because the sea line is set by the ship and the shipping line, and no estate changes it, while the road line is set by where the plant sits relative to the quay. The government’s answer, Perpres 41 of 2026 on strengthening national logistics, promulgated on 16 July 2026, works the other side of the same line: infrastructure and connectivity, integration and digitalisation, and the trucking fleet itself. A plant can wait for the road to get cheaper, or it can shorten it.
What Distance to Berth Removes, Line by Line
For bulk cargo the distance between plant and berth is not one cost but four, and each one scales differently. Naming them is what lets you put your own numbers in.
- The haul. A tanker or tipper carries a fixed payload, so the cost per tonne is the trip cost divided by the payload, and the trip cost rises with every kilometre of the round trip.
- The handovers. A truck route loads at the plant and discharges at the quay or tank farm. Each handover is labour, pumping and time. At Pangkal Balam, PTP Nonpetikemas cut its truck-to-barge operating cost from Rp4,000 to Rp2,800 a tonne by replacing truck-side discharge with a drop tank and submersible pumps, lifting pump capacity from 40 to 200 tonnes an hour, according to the operator. That is what a handover costs even when it is done well.
- The losses. Every transfer of crude palm oil is a gauging error, a heel left in a tank and a reheating cycle, and every transfer of a dry bulk is dust and spillage. A pipeline or conveyor has one transfer; a truck route has at least two more.
- The fleet. A truck that turns six trips a day at 5 km is six trucks at 100 km. The hire rate is the same; the output is not, and the queue at the gate grows with the fleet.
Our guide to liquid bulk terminal design covers what the pipeline alternative looks like at the tank farm end.
If you would rather run these lines against a real plot than a worked example, request current land availability and our team will reply with the distances to the quay and the jetty.
The Model: One Plant, Three Distances
The plant is a CPO refinery moving 500,000 tonnes a year to a ship, by tanker truck, at 5 km, 30 km and 100 km from the berth. Everything else is held equal, and every input is listed so you can replace it.
| Assumption | Value used | Basis |
|---|---|---|
| Annual tonnage | 500,000 t, 300 working days | Plant profile for the model; a mid-sized refinery |
| Tanker payload | 18 t | Tronton-class payload of 15 to 20 t in published 2025 to 2026 truck specifications |
| Trip cost | Rp600,000 fixed plus Rp12,000 per round-trip kilometre | Fixed element for loading, gate and driver time; the per-km rate sits in the lower half of the published tronton range of Rp9,800 to Rp36,000 |
| Exchange rate | Rp17,900 per US$ | Bank Indonesia JISDOR, early October 2026 |
| Trips per truck per day | 6 at 5 km, 3 at 30 km, 1 at 100 km | Assumption, including loading and discharge time |
| Quay handover operating cost | Rp4,000 per tonne | Pangkal Balam pre-innovation figure, as a conservative proxy |
| Transfer loss and quality allowance | 0.1% of cargo value per road handover, two handovers | Assumption; cargo at the October 2026 CPO reference price of about US$1,042 a tonne |
The trucking line is the only one with a market input, and even that is a range. The trips-per-day line and the loss allowance are the ones to replace with your own fleet records and your own quality claims.
The Results per Tonne and per Year
With those inputs, the cost of distance comes out as follows. The pipeline column is the planned in-estate case, with a pumped transfer costed at the Pangkal Balam post-innovation rate and no road handovers, and it is a design target, not an operating figure.
| Cost line, US$ per tonne | 5 km by truck | 30 km by truck | 100 km by truck | Under 5 km by pipeline (planned) |
|---|---|---|---|---|
| Haul | 2.23 | 4.10 | 9.31 | 0 |
| Quay handover | 0.22 | 0.22 | 0.22 | 0.16 |
| Transfer loss allowance | 2.08 | 2.08 | 2.08 | 0 |
| Total per tonne | 4.53 | 6.40 | 11.61 | 0.16 |
| Total per year, 500,000 t | US$2.27 million | US$3.20 million | US$5.81 million | US$0.08 million |
| Tankers needed at 93 loads a day | 15 | 31 | 93 | none |
Three things in the table matter more than the totals.
First, the haul is the line distance moves, and it moves fast: US$2.23 a tonne at 5 km becomes US$9.31 at 100 km, a difference of US$3.5 million a year on this plant before anything else is counted. Halve the trucking rate and the 100 km site still pays about US$1.8 million a year more than the 5 km site on the haul alone.
Second, the handovers do not shrink with distance. The 5 km truck route still pays the two road handovers and their loss allowance, which is why it costs US$4.53 a tonne against US$0.16 for the pipeline case. Short distance helps; removing the truck altogether is a different order of saving. That is the whole argument for a plot with a pipeline corridor to the jetty, and the reason we would rather sell a plot by its manifold position than by its gate position.
Third, the fleet is the operational cost that never appears on a freight invoice. 93 tankers a day at 100 km is a transport company, with its own yard, its own safety record and its own queue at the quay. 15 at 5 km is a shift.
For a container shipper the same distances produce a different table, dominated by detention and inventory rather than haul; our landed-cost model for a port-integrated estate runs that case.
What the Model Does Not Count
A model that counts only what favours the estate is marketing, so here is the other column.
- Sea freight and port tariffs. Held equal because they are. The ship charges the same from Belawan whatever the cargo did on land.
- Pipeline capital cost. The pipeline column carries operating cost only. A dedicated line, pumps and heated storage are capital the tenant or the estate must fund, and the saving in the table is what pays for it, not proof that it always does.
- Land price and service charge. A plot with a pipeline corridor can cost more. The premium the model finds is the budget available to pay for one.
- Readiness. A truck route to an operating public port exists today. A pipeline to a planned berth does not exist until the berth does, and status, not geography, decides the first years.
- Dry bulk. The same model with a 20-tonne tipper on 1 million tonnes a year gives US$2.01, US$3.69 and US$8.38 a tonne for the haul at 5, 30 and 100 km, and a fleet of 28, 56 and 167 trucks. The shape is the same; the dust is extra.
Where SIIPE Stands
SIIPE (Sumalacca Integrated Industrial and Port Estate) is a planned 5,600-hectare integrated industrial estate, deep seaport and township in Medan Belawan, North Sumatra. Around 840 hectares has been acquired; 4,760 hectares remains to be acquired or reclaimed. The current development phase covers 3,000 hectares: 1,800 ha industrial estate, 400 ha deep seaport and 800 ha residential township.
Two distances define its logistics case. Today the site is 4.7 km from Belawan Port, about 10 minutes by road, which is the 5 km truck column in the model against an operating port. Belawan’s liquid bulk terminal has a stated capacity of up to 6 million tonnes and ships 3.5 to 4 million tonnes of CPO a year, mainly to China and Japan, according to Pelindo Multi Terminal’s Belawan branch. Our guide to Indonesia’s bulk terminals puts that in context.
The pipeline column is the masterplan. Every plot is designed to sit under 5 km from the estate’s own berth at the Sumalacca Dry & Liquid Bulk Port, which is planned, not operational, with a basin designed at -8 to -10 m LWS and a 13 nautical mile approach channel, suited to Handysize and smaller Supramax vessels. The jetty facility and the chemical storage tanks on the estate’s infrastructure list are planned as well, and the plan states no capacities or operational status, so we quote none. For CPO in particular, the case is argued in full in our crude palm oil guide.
That is the honest shape of it. Against an inland site, SIIPE offers the 5 km truck position to Belawan now and the pipeline position to its own berth when it is built. Which column you should model against depends on your timeline, and we would rather you ran the table than took our word.
Frequently Asked Questions
What is Indonesia’s logistics cost as a share of GDP?
The government’s baseline is 14.29% of GDP in 2022. Perpres 41 of 2026, promulgated on 16 July 2026, sets an intermediate target of 12.5% and a long-term target of 8% by 2045. A 2022 breakdown puts road transport at about 7 percentage points, roughly half of the total.
What is Perpres 41 of 2026?
Presidential Regulation 41 of 2026 on strengthening national logistics, promulgated on 16 July 2026. It sets three strategies, infrastructure and connectivity, integration and digitalisation, and human resources and service providers, and assigns the Coordinating Minister for Economic Affairs to coordinate the national logistics ecosystem toward the 8% target.
How much does trucking CPO cost per tonne in Indonesia?
In our model, a tronton-class tanker with an 18-tonne payload at Rp600,000 per trip plus Rp12,000 per round-trip kilometre costs about US$2.23 a tonne at 5 km from the berth, US$4.10 at 30 km and US$9.31 at 100 km, before handover charges and transfer losses. Rates vary by corridor.
Why does distance to the berth matter more for bulk cargo than for containers?
A container is sealed once and trucked at any distance. Bulk cargo is pumped or tipped at every transfer, so each road handover adds labour, time and loss, and the alternative of a pipeline or conveyor only exists within a few kilometres of the berth. Distance decides whether that alternative is available at all.
Is SIIPE’s port operational?
No. The Sumalacca Dry & Liquid Bulk Port is planned, not built, and is a medium-term objective on the SIIPE roadmap. Today the estate’s logistics position rests on its 4.7 km distance to the operating Port of Belawan, with plots designed to sit under 5 km from the planned berth.
Request Land Availability at SIIPE
If the table puts your plant within pipeline reach of a berth, the next step is a plot, and the plot that matters is the one whose tank farm and jetty line up. Tell us your industry, whether you need under 5 hectares, 5 to 20, 20 to 50 or more than 50, and your investment timeline, and we will reply with current availability and indicative terms. SIIPE is a planned 5,600-hectare estate in Medan Belawan with a current 3,000-hectare development phase, around 840 hectares acquired, and a site 4.7 km from Belawan Port; its port and utilities are planned rather than operational, and we will say so in every reply.
Request land availability through the enquiry form, or message us on WhatsApp at +62 811 860 980.
=== /logistics-cost-in-indonesia/ ===